Crypto · Stocks · Forex · Indices · Commodities

Understand what the market is really doing

InvestAI reads 21 technical indicators and the price action of any asset, then writes a clear synthesis: what the data shows, what supports it, what contradicts it — and how much confidence it deserves.

  • Free to download
  • No orders, no funds held
  • 13 languages
Price, moving average, Bollinger bands and RSIIllustration
7030RSI
AI synthesis

Signals are mixed: momentum is improving but the price is still below its resistance. A close above it would change the picture.

InvestAI screen showing the technical indicators of an asset with bullish, neutral and bearish readings

One app for every market you follow

  • 384Stocks41 countries, 6 continents
  • 60Forex pairsMajors to emerging
  • 48Stock indicesWorldwide
  • 30CommoditiesMetals, energy, farming
  • 21IndicatorsFree choice or presets
  • 13LanguagesIncluding Arabic and Urdu

Features

Three readings of the same chart

Indicators, price action and AI synthesis answer different questions. InvestAI keeps them separate so you always know where a conclusion comes from.

Technical indicators

21 technical indicators, each with its own reading

RSI, MACD, moving averages, Bollinger, Ichimoku, SuperTrend, ADX, OBV, MFI and more. Pick them one by one or start from a preset — Essentials, Trend following, Mean reversion, Volume confirmation. Each one says whether its reading is bullish, neutral or bearish, and why.

Read the guide
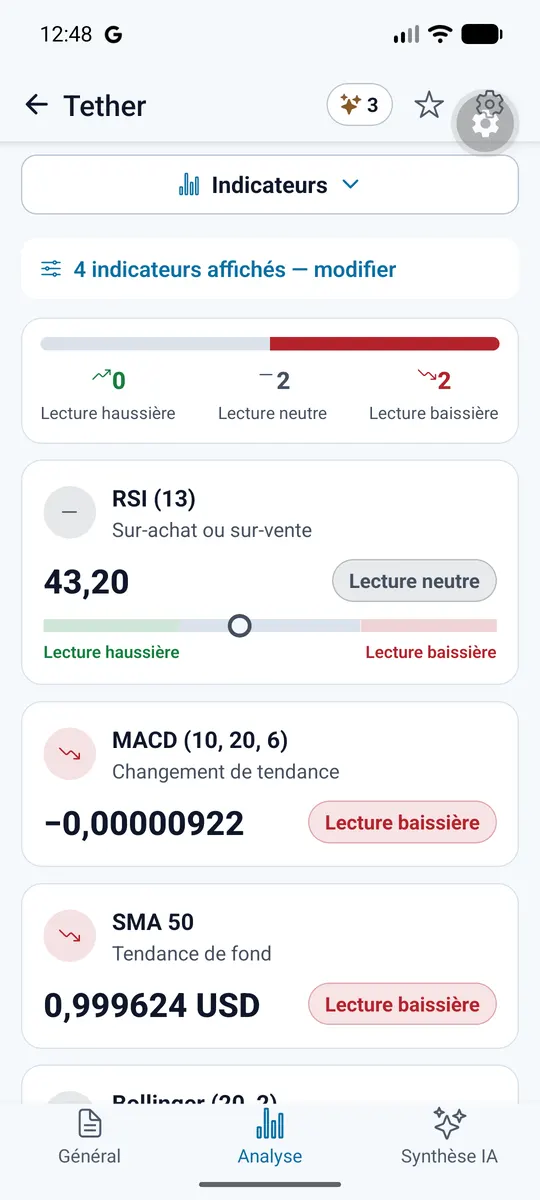
Indicator list for an asset with RSI, MACD and SMA readings
Price action

Price action, read without indicators

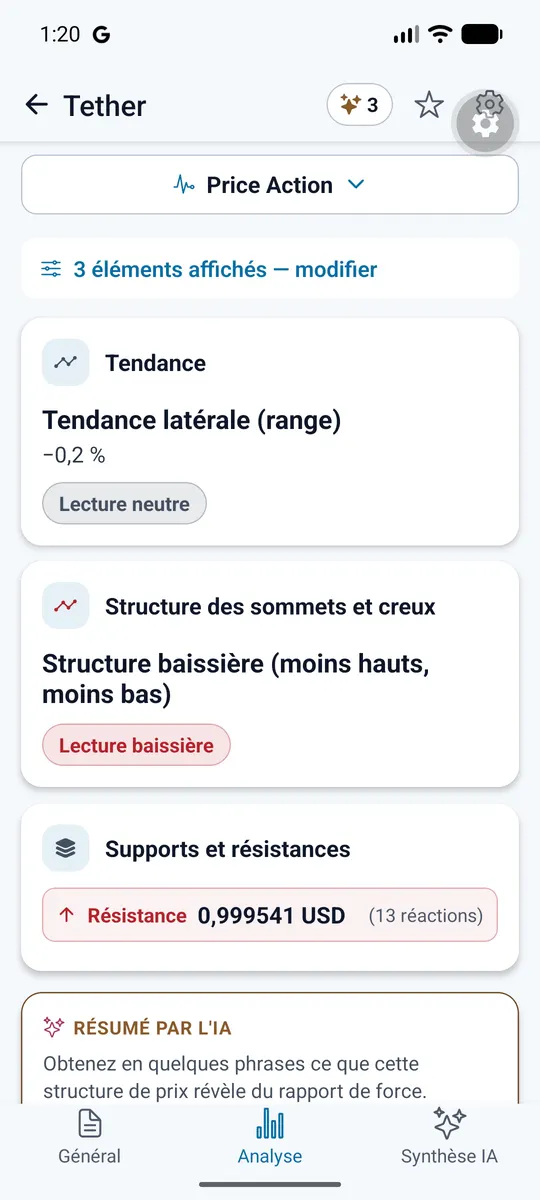
Trend, structure of highs and lows, support and resistance zones with the number of times price reacted to them, candlestick patterns, unfilled gaps, position in the range and range expansion.

Read the guide
Price action screen showing trend, market structure and a resistance zone
AI synthesis

An AI synthesis in five parts

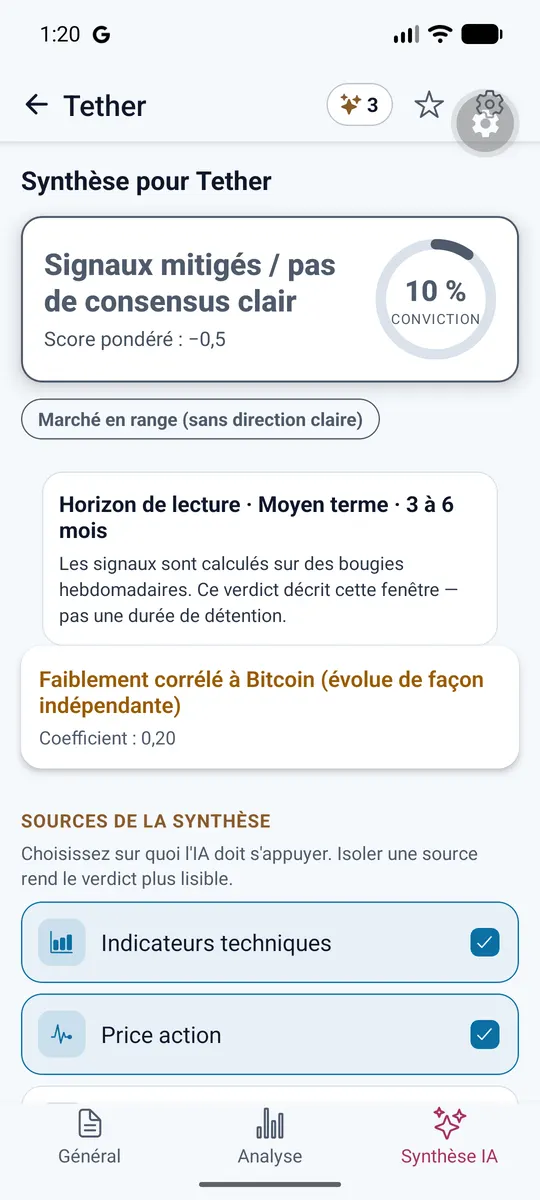
What the data shows, what supports it, what contradicts it, what would change the picture, and how much confidence to give it. You choose what the AI reads: indicators only, price action only, or both. Correlation with the benchmark and the detected market regime are included.

Read the guide
AI synthesis screen with a conviction score and the detected market regime

Three taps, one clear reading

  1. 1

    Pick an asset

    Browse by market — crypto by category, stocks by continent and country, forex pairs, indices, commodities — or search by name.

  2. 2

    Run the analysis

    Choose your reading horizon. Indicator periods adapt to it, so a short-term and a long-term reading are not the same calculation.

  3. 3

    Read the verdict

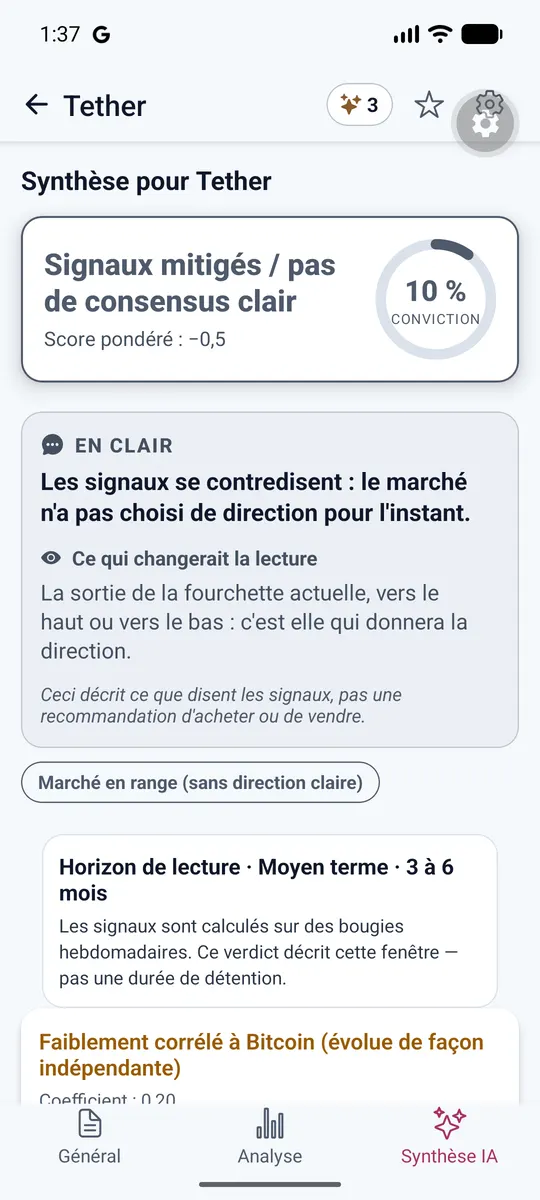
    See where the market leans, how strongly, and the plain-language reasons behind it. Add the asset to favourites to have it analysed every day.

A 30-second tour of InvestAI.

A missing reading beats a false one

Every indicator declares the data it needs. When a market's source provides neither open nor high/low prices — forex pairs, for example — InvestAI shows “unavailable on this market” instead of computing a figure from invented values.

InvestAI screen explaining an analysis in plain words

Guides

Learn technical analysis, step by step

Free, in-depth guides to the tools InvestAI uses — how they are calculated, how to read them, and where they mislead.

RSI

The Relative Strength Index: formula, the 70/30 levels, divergences and the traps of “overbought”.

Read the guide

MACD

Moving Average Convergence Divergence: MACD line, signal line, histogram and what crossovers really say.

Read the guide

Moving averages

SMA vs EMA, the 20/50/200 averages, golden and death crosses, and how to use them as dynamic support.

Read the guide

Bollinger Bands

Volatility bands around a moving average: squeezes, band walks and why a touch is not a signal.

Read the guide

Price action

Trend, highs and lows, support and resistance, candlesticks and gaps: reading the chart without indicators.

Read the guide

AI synthesis

How InvestAI turns indicators and price action into a five-part written analysis — and its limits.

Read the guide

Markets covered

Crypto by category, 384 stocks in 41 countries, 60 forex pairs, 48 indices and 30 commodities.

Read the guide

Ichimoku

The Ichimoku Cloud: Tenkan, Kijun, Senkou spans and Chikou, and how to read them together.

Read the guide

Fibonacci

Fibonacci retracements: the 38.2, 50 and 61.8 levels, how to draw them, and why they are not magic.

Read the guide

Candlesticks

Japanese candlestick patterns: hammer, doji, engulfing, stars and what context they need.

Read the guide

Support & resistance

Support and resistance zones: how to find them, how many touches matter, and what a breakout really means.

Read the guide

Volume & OBV

Volume and On-Balance Volume: confirming moves, spotting weak breakouts, and the limits on crypto and forex.

Read the guide

Stochastic

The Stochastic Oscillator: %K, %D, the 80/20 zones, and why overbought is not “sell”.

Read the guide

ATR & volatility

Average True Range and volatility: how to measure it, compare assets, and use it for context.

Read the guide

Divergences

Divergences between price and indicators: regular, hidden, and how often they fail.

Read the guide

Risk management

Position sizing, stop distance, risk-reward and drawdown: the maths that decides how long you last.

Read the guide

FAQ

What is InvestAI?

A multi-market technical analysis app. It calculates 21 indicators, reads the price action and can write a synthesis in plain words, for crypto, stocks, forex, indices and commodities.

Does InvestAI give investment advice?

No. InvestAI is an information and education tool. It gives no investment advice, no personalised recommendation, and never tells you to buy or sell.

Can I buy or sell assets in the app?

No. InvestAI is not a broker: it places no orders, holds no funds and manages no portfolio.

Is the data in real time?

No. Analyses use closing prices updated daily.

Is InvestAI free?

Downloading is free, as are prices and charts on every market. Full analysis is free on one asset of your choice; Premium unlocks it on every asset and includes 40 AI credits per month.

All questions

Support

Help and contact

A question about the app, a purchase, your account or your personal data? Write to us — we answer every message.

marketinvestai@gmail.com

Read the market more clearly

Indicators, price action and a plain-language synthesis for crypto, stocks, forex, indices and commodities. Free to download.

Not investment advice. For information and education only.